SciVis 2013 Project 1 Tips
- Basic program structure
- Example code
- Linear Interpolation of RGB control points
- Univariate map demo
- Bivariate map demo
- Second bivariate map demo
Basic program structure
Summary of the basic structure of the program you write for the univariate colormapping:- Read in the (16-bit) gray-scale data image
- Read in the colormap (a text file)
- Create an array for the output (8-bit) RGB image
- For each pixel of input image:
- Get the input data value
- Determine where that value falls in the sequence of colormap control points (one per line)
- Perform a linearly interpolation between the control points to find the output RGB color
- Set the color in the corresponding pixel of the output RGB image.
- Save the output RGB image as an 8-bit PNG
- There are two input images instead of one
- The colormap is a 256x256 8-bit RGB image
- At each pixel, the output color is determined by
- Dividing the first (in our case Democratic) image value by 256 to get index DI
- Dividing the second (in our case Republican) image value by 256 to get index RI
- Find the RGB color the colormap image at the DI'th pixel going from left to right, and the RI'th pixel going from top to bottom. In matrix-speak, this is at the RI'th row and the DI'th column (except with 0-based indexing). For example: (DI,RI)=(0,0) is upper left, (DI,RI)=(255,0) is upper right, (DI,RI)=(0,255) is lower left, (DI,RI)=(255,255) is lower right.
Example code
Here are some simple Python/Numpy programs that may contain elements of functionality that you'll need for the project.- read.py: reads in 16-bit grayscale six.png and prints out some of its values.
- writeRGB.py: writes out two 8-bit RGB images, with arrays that were created in two different ways. See if you can generate the same rgb1.png and rgb2.png.
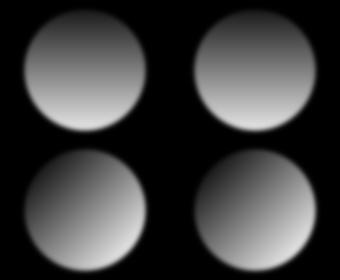
Linear Interpolation of RGB control points
The assignment asks you to create and apply univariate colormaps that are saved as text files, and to map values through RGB colors by linear interpolation between control points. Here's an illustration of linearly interpolating an output value from y0 to y1 as in input value changes from x0 to x1:
Interpolating colors between the second control point at x0=21845 and the third control point at x1=43690 will be needed for any input data values between 21845 and 43690. Between these two control points, the green channel is varying, so in the formula above, y0=0 and y1=255.0 0 0 0 21845 255 0 0 43690 255 255 0 65535 255 255 255
Univariate map demo
Here is the data/synth/ramp16.png dataset from the scivis-2013 repository:
This colormap, by the way, is not going to be useful for any of the tasks in Project 1.0 0 0 0 10000 255 0 0 30000 0 255 0 50000 0 0 255 65535 255 255 255
Here is the result of applying that colormap to the ramp image:

Bivariate map demo
The two 16-bit grayscale source images bivarA.png and bivarB.png
A simple bivariate colormap is maggrn-map.png:

The result of applying the bivariate map to the two images, maggrn-out.png:

Second bivariate map demo
This uses the same bivarA.png and bivarB.png source images as above. The bivariate map phnx-map.png
